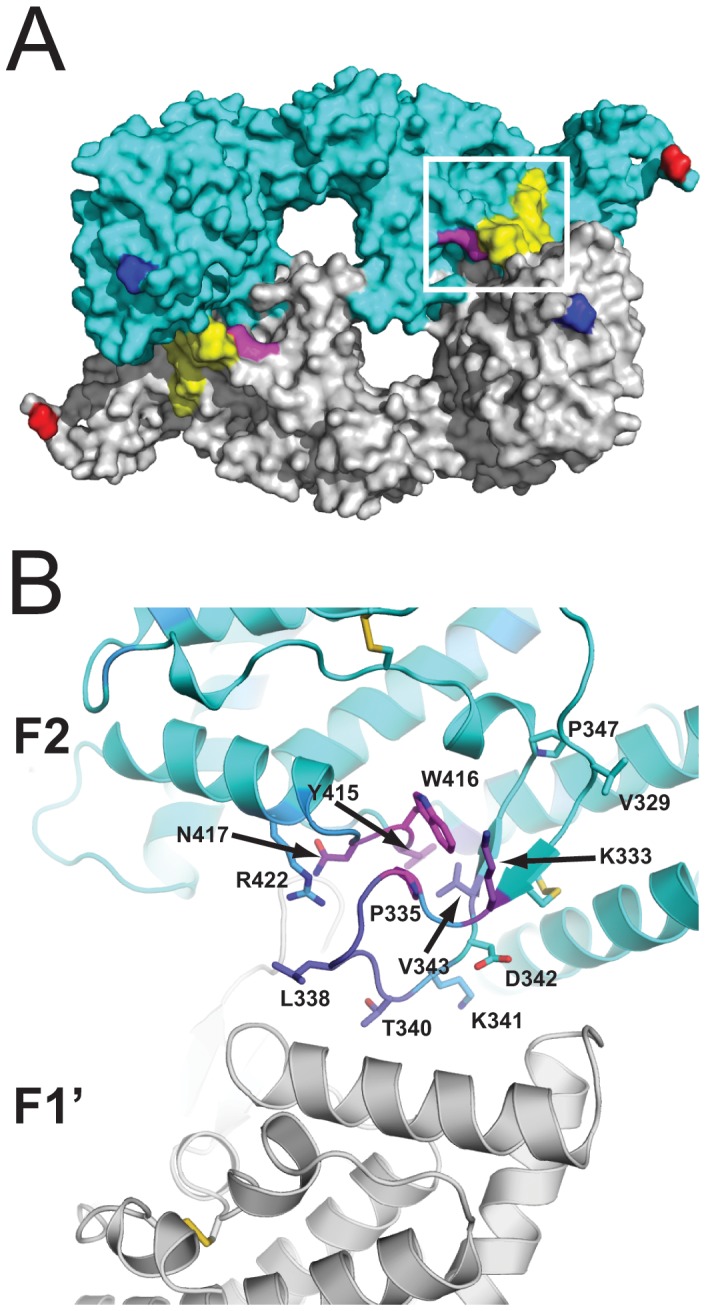
Figure 1. Mapping of epitope predictions to the rEBA-175 RII crystal structure.

(A) rEBA-175 RII crystal structure as a dimer of two RII molecules (cyan and grey), the region corresponding to the F2βf peptide is highlighted in yellow and R422 is highlighted in magenta. The amino- and carboxy- terminal residues are colored in blue and red respectively. The white box represents the region highlighted in panel B. (B) The F2 domain of one monomer in the rEBA-175 RII crystal structure is shown as a ribbon diagram and residues are colored by the number of times they were predicted by either PepSurf and Mapitope to be part of the epitope for mAbs R215, R217, or R256 from never (cyan) to most often (magenta; see SOM for raw data). Residues discussed in the text are labeled according to rEBA-175 RII numbering (EBA-175 3D7 sequence number –144) and shown in stick representation.
