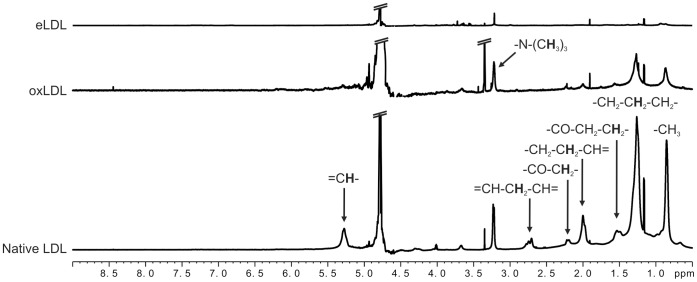
Figure 1. Representative NMR spectra of native LDL, oxLDL and eLDL.
(Bottom) Native LDL gave rise to lipid signals predominantly of methyl and methylene protons of fatty acid chains. (Center) NMR spectra of oxLDL showed substantially decreased lipid signals compared to native LDL. (Top) eLDL spectrum: resonances of lipids were virtually absent. Instead, amino acid signals and mobile protein peaks were observed. NMR spectral parameters: 800 MHz spectrometer frequency, 1D-NOESY pulse sequence with water presaturation (noesygppr1d), 7.7 s repetition time, 10 ms mixing time, temperature: 25°C. Spectral annotation according to dominant contributions to NMR signals. Spectra were normalized to the concentration of apoB-100 determined prior to oxidation or modification. Each LDL subtype was investigated on the basis of at least three replicates from different donors, N = 3 except for “oxLDL” (N = 2).

