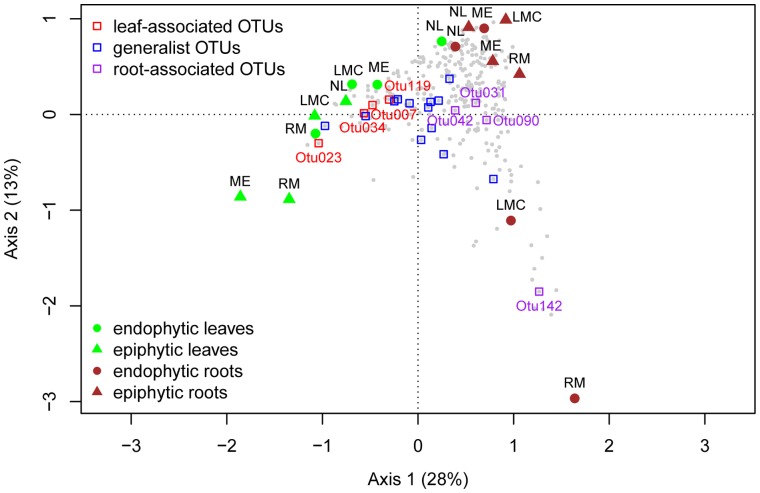
Figure 3. Correspondence analysis illustrates differences between bacterial communities in roots and leaves at 4 sites.
The two axes represent 41% of the inertia. OTUs are represented in gray; OTUs from the core community are highlighted in three colors: red OTUs are more abundant in the leaf-associated community while purple OTUs are more abundant in the root-associated community, generalist OTUs are labeled in blue.

