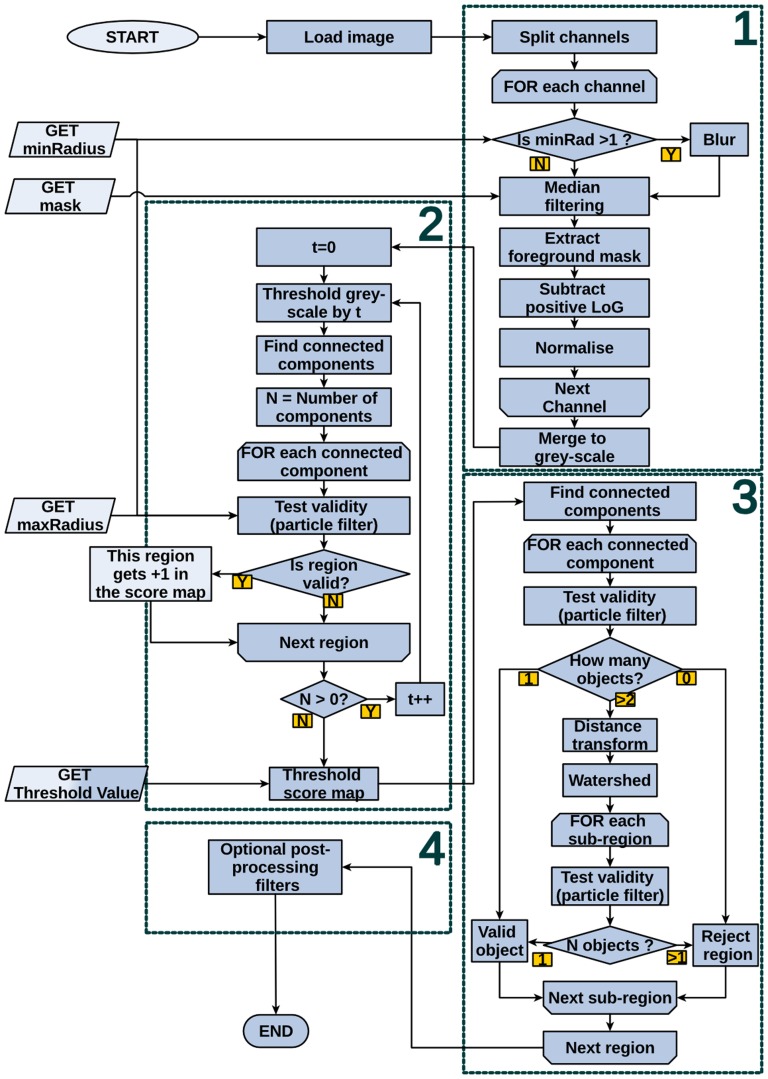
Figure 1. Flowchart representing the processing steps.
The image is preprocessed (1) in order to correct for gradual changes in background intensity and increase the contrast. The first pass of the processing (2) generates a score-map by iteratively annotating valid regions. The second pass (3) involves finding connected components in the thresholded score-map and segmenting them using a distance transform/watershed approach. Optional postprocessing filters (4) can be performed by OpenCFU or, using the raw data, by the user.

