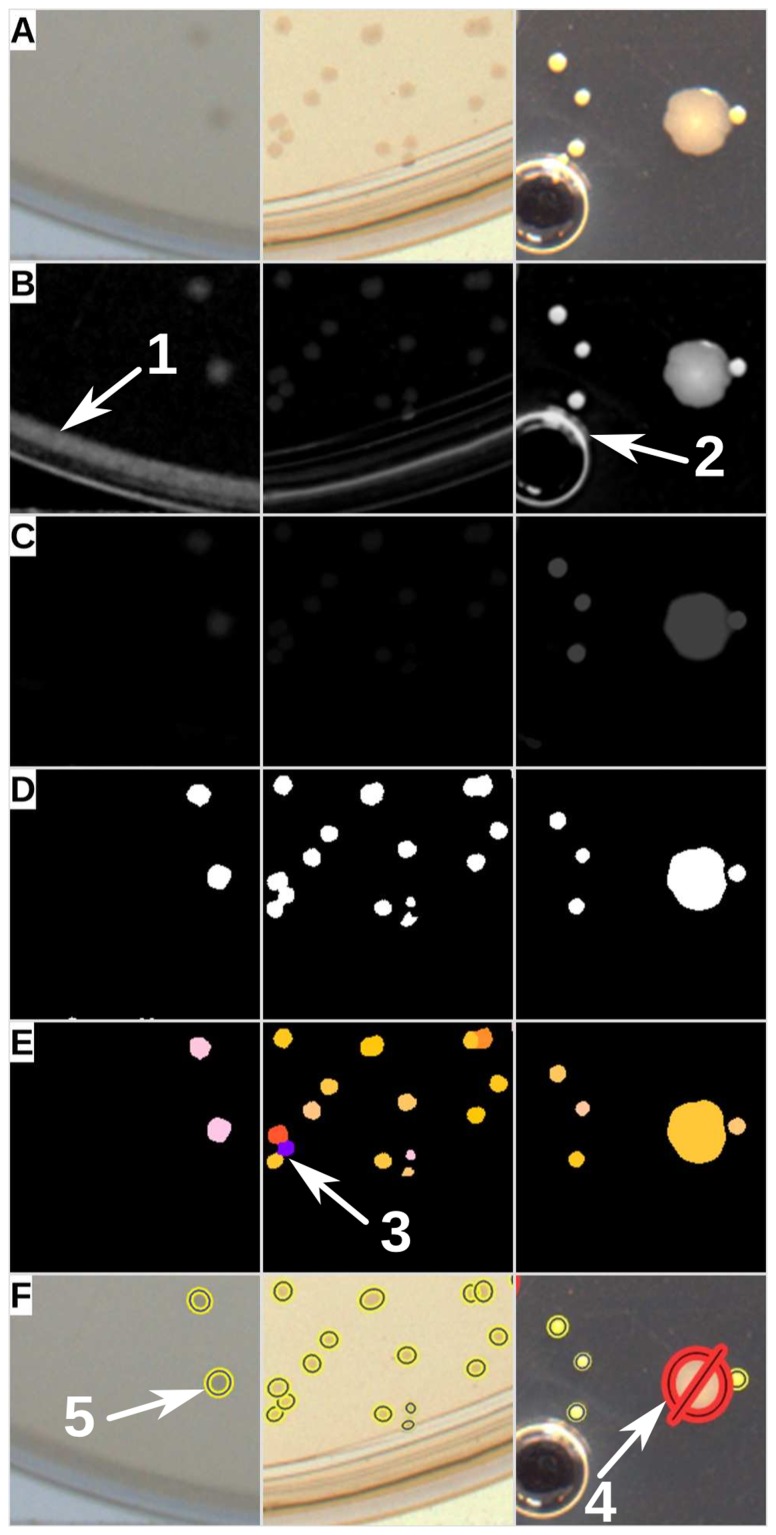
Figure 2. Illustration of the processing steps performed on three sample images.
Each channel of the original image (A) is preprocessed individually and merged to a grey-scale image (B). A score-map is generated by recursive thresholding an annotation of circular regions (C). This excludes regions that were morphologically unlikely to be colonies (i.e. arrows 1 and 2). The score-map is then thresholded by a user-defined or automatically calculated value (D). The objects identified as merged colonies (on the basis of their morphological features) are segmented using a watershed variant on their distance transform (E). Arrow 3 shows objects that have been successfully segmented. Finally, the morphologically valid objects can be assessed further using intensity and colour filters. Arrow 4 shows a minority contaminant bacteria that was excluded using postprocessing filter and represented by crossed-out red ellipses. Arrow 5 shows valid colonies represented by yellow and blue ellipses. For the purpose of explanation, only representative areas (200 200 pixels) of three processed images are shown here.

