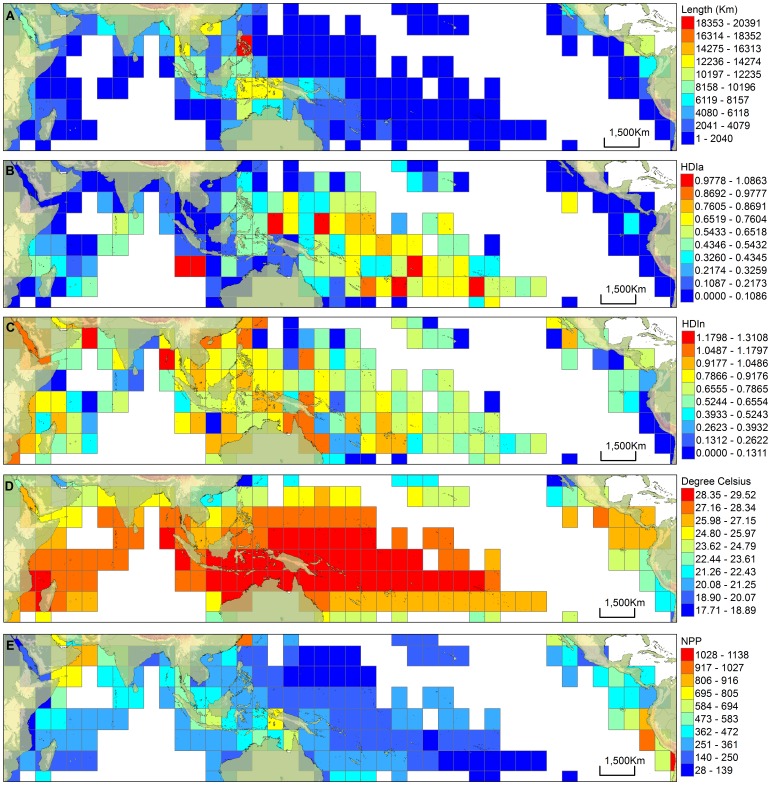
Figure 3. Distribution pattern of the different parameters in the Indo-Pacific using UTM grid.
The grids were classified (equal interval) into 10 classes based on the amount of shallow water area recorded in each cell such that cells in red have the largest parameter value, and cells in blue have the lowest parameter value. Cells with zero values are not displayed. (A) Extent of coastline (km), (B) Habitat heterogeneity index using area (HDIa), (C) Habitat heterogeneity index using number (HDIn), (D) Sea surface temperature (SST), (E) Net primary productivity (NPP).

