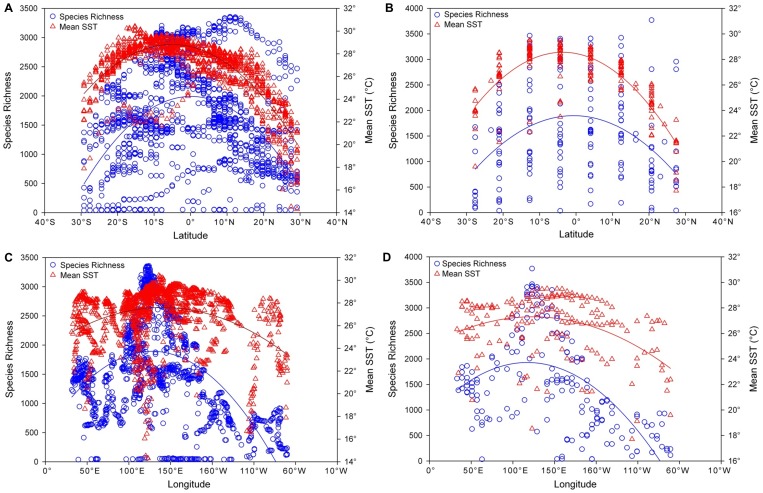
Figure 4. Species richness and mean SST versus latitude or longitude at different grid scales.
(A) Latitude at small grid, (B) Latitude at UTM grid, (C) Longitude at small grid, (D) Longitude at UTM grid. Latitudinal peaks of species richness (blue circle) are shown along the 10–20° north and latitudinal peaks in mean SST values (°C) (red triangle) are along the 10–20° south. Longitudinal peaks of species richness (blue circle) are located in the 120° east while longitudinal peaks in mean SST values (°C) (red triangle) are found along the 130–150° east.

