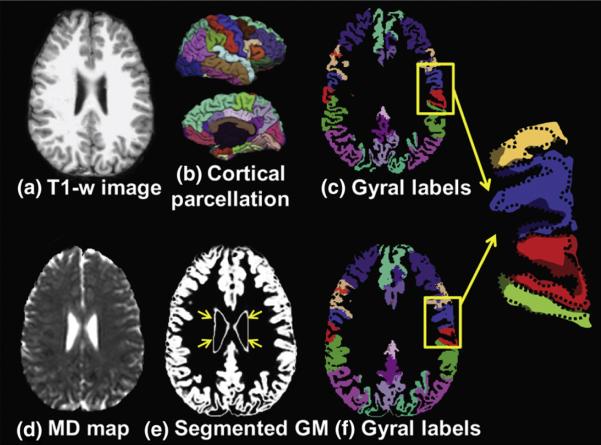
Fig. 2.
T1 weighted image (a), the 3D cortical gyral parcellation (b), the gyral parcellation map of T1 weighted image (c), MD map (d), GM segmentation from b0 image (e), and gyral labels of MD map (f) are shown. The enlarged gyral parcellation maps from the highlighted yellow box show dramatic shape differences of two gyral parcellation maps. Complete alignment between (e) and (f) is apparent. (b), (c) and (f) use same color scheme to represent gyral labeling.

