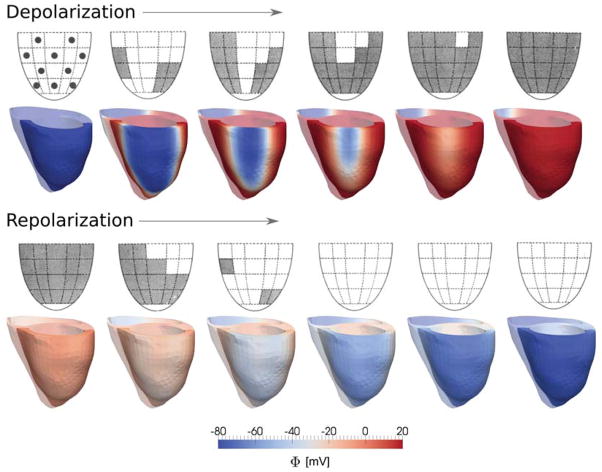
Figure 6.
Depolarization and repolarization sequences in the healthy human heart. The experimental sequences, top rows, represent the depolarization and repolarization of the left ventricle, averaged over ten healthy individuals, where grey regions indicate activated epicardium; reprinted with permission from (Cowan et al. 1988). The computational sequences, bottom rows, represent the depolarization and repolarization of a healthy human heart, where the red regions indicate activated myocardium.

