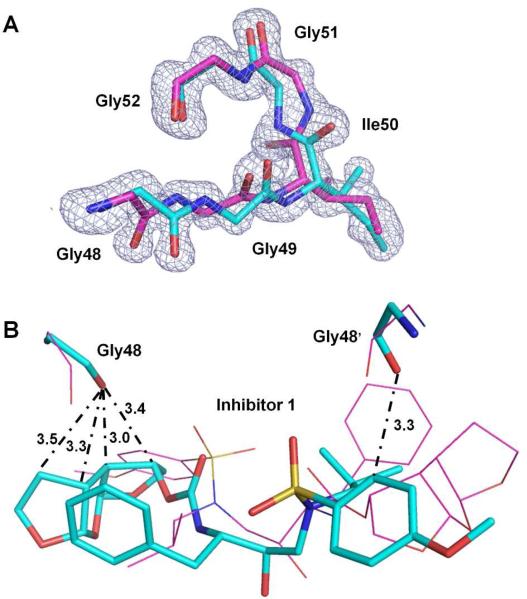
Figure 3.
(A) Fo-Fc omit map (contoured at 3.0 σ) for the flap residues Gly48 - Gly52 in complex PRI54M–inhibitor 1 (1.06Å). Carbon atoms are colored cyan and magenta for the major and minor conformations, respectively. (B) Interactions of Gly48/48’ with inhibitor 1 in complex PRI50V–inhibitor 1 (0.7/0.3 occupancy). The major and minor conformations of Gly48/48’ and the inhibitor 1 are represented by sticks with carbon atoms colored cyan and lines with carbon atoms colored magenta, respectively. C-H...O interactions between the major conformations are indicated by dash-dot lines with distances in Å. C-H...O interactions between the minor conformations are the same but not shown here for clarity.

