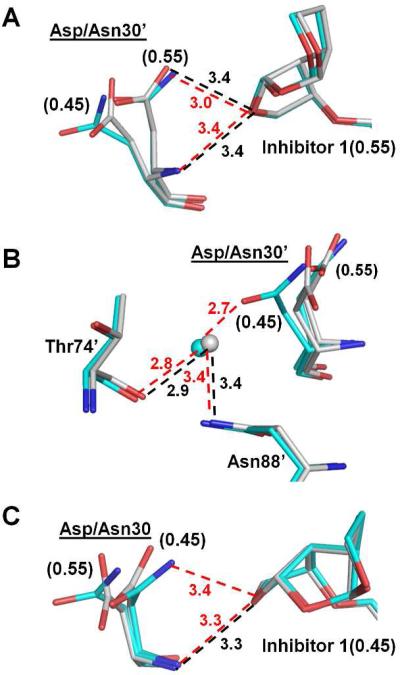
Figure 4.
Structural changes of PRD30N. Carbon atoms are colored gray for PRWT–inhibitor 1 and cyan for PRD30N–inhibitor 1. Hydrogen bond interactions in PRWT–inhibitor 1 and PRD30N–inhibitor 1 are represented by black and red dashed lines, respectively, with distances in Å. Water molecules are shown as gray and cyan spheres for PRWT–inhibitor 1 and PRD30N–inhibitor 1, respectively. Occupancies for alternative conformations are labeled in parentheses for Asp/Asn30’. (A) Interactions of Asp/Asn30’ with the major conformation of inhibitor 1. (B) Interactions of Asp/Asn30’ with the neighboring residues. (C) Interactions of Asp/Asn30 with the minor conformation of inhibitor 1.

