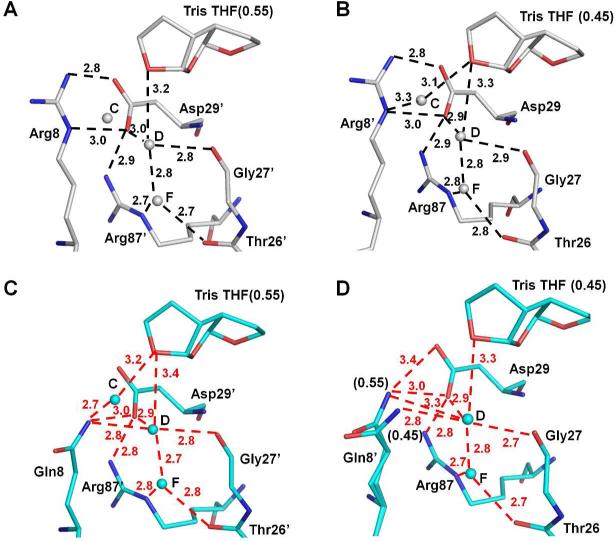
Figure 7.
Structural changes of PRR8Q. (A-B) Interactions of Arg8/8’ in PRWT–inhibitor 1. (C-D) Interactions of Gln8/8’ in PRR8Q–inhibitor 1. Carbon atoms are colored gray for PRWT–inhibitor 1 and cyan for PRR8Q–inhibitor 1. Water molecules are shown as gray and cyan spheres for PRWT–inhibitor 1 and PRR8Q–inhibitor 1, respectively. The hydrogen bond interactions are indicated by the dashed lines with distances in Å. Occupancies for alternative conformations of inhibitor 1 and Gln8’ are indicated in parentheses. Hydrogen bond interactions in RR8Q–inhibitor 1 are colored red. Interactions between water molecules C and D in all figures (7A-7D) are omitted for clarity.

