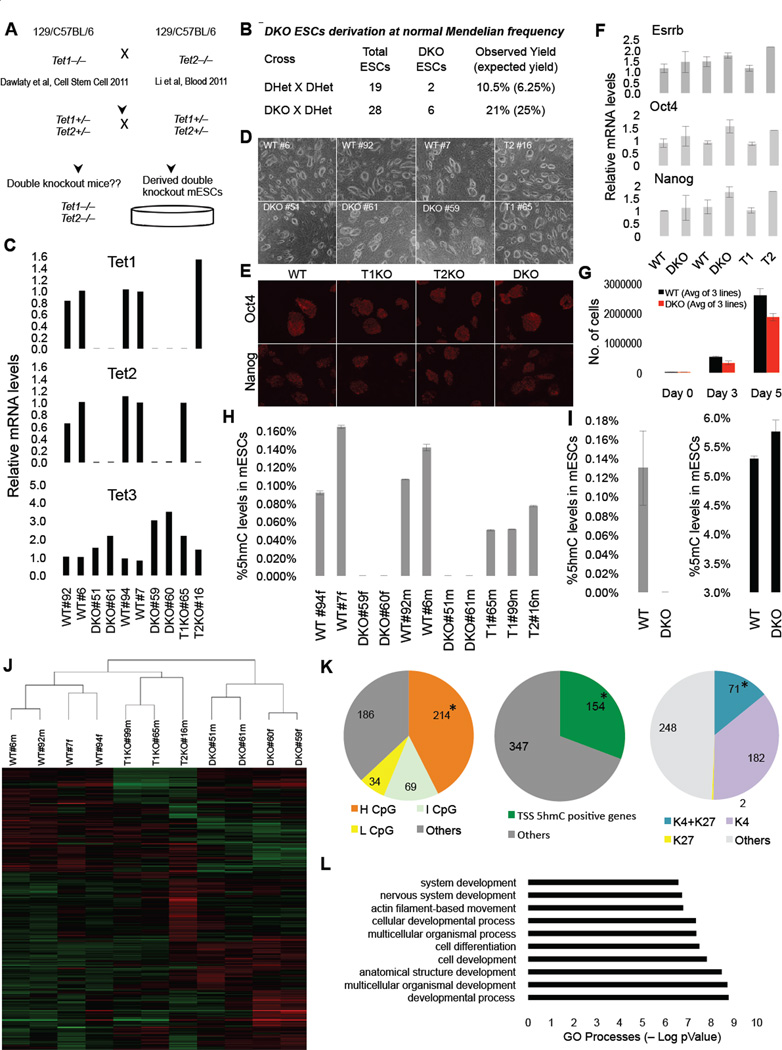
Figure 1. Tet1 Tet2 double knockout (DKO) ESCs are depleted of 5hmC and express pluripotency markers.
(A) Schematic of crosses to generate DKO ESCs. (B) Summary of derived ESCs and Mendelian frequency of DKO ESC. (C) RTqPCR for Tet1, Tet2 and Tet3 ESCs of indicated genotypes. Notice that DKO ESCs are depleted of Tet1 and Tet2 mRNA. Data are normalized to Gapdh. (D) Bright field images of ESCs of indicated genotypes. (E) Immunostainning for pluripotency markers Oct4 and Nanog in ESCs. (F) Relative mRNA levels of Esrrb, Nanog and Oct4 in ESCs. Data are normalized to Gapdh. (G) WT and DKO ESCs 5-day cell proliferation count. (H & I) Quantification of 5hmC and 5mC in ESCs of indicated genotypes by mass spectrometry (LC-MS/MS-MRM). Notice in DKO ESCs 5hmC levels are below detection level. (J) Heat map of differentially expressed genes across a panel of wild type, single knockouts and DKOs ESCs. Genes differentially expressed in at least one of the comparisons are displayed. Intensity values are log2 transformed and genes are centered by mean intensity across all arrays. A total of 501 genes are deregulated in DKO ESCs. (K) Pie charts categorizing deregulated genes into sub categories of CpG rich genes (left), TSS 5hmC positive genes (center) and H3K4me and H3K27me bivalent genes (right) in ESCs. Asterisk indicates enriched and statistically significant. (L) Gene ontology analysis of 501 differentially expressed genes in DKO ESCs showing that most GO terms are implicated in development. For all panels m=male cell line and f=female cell line. Error bars indicate s.d. See also Figure S1 and Table S2.

