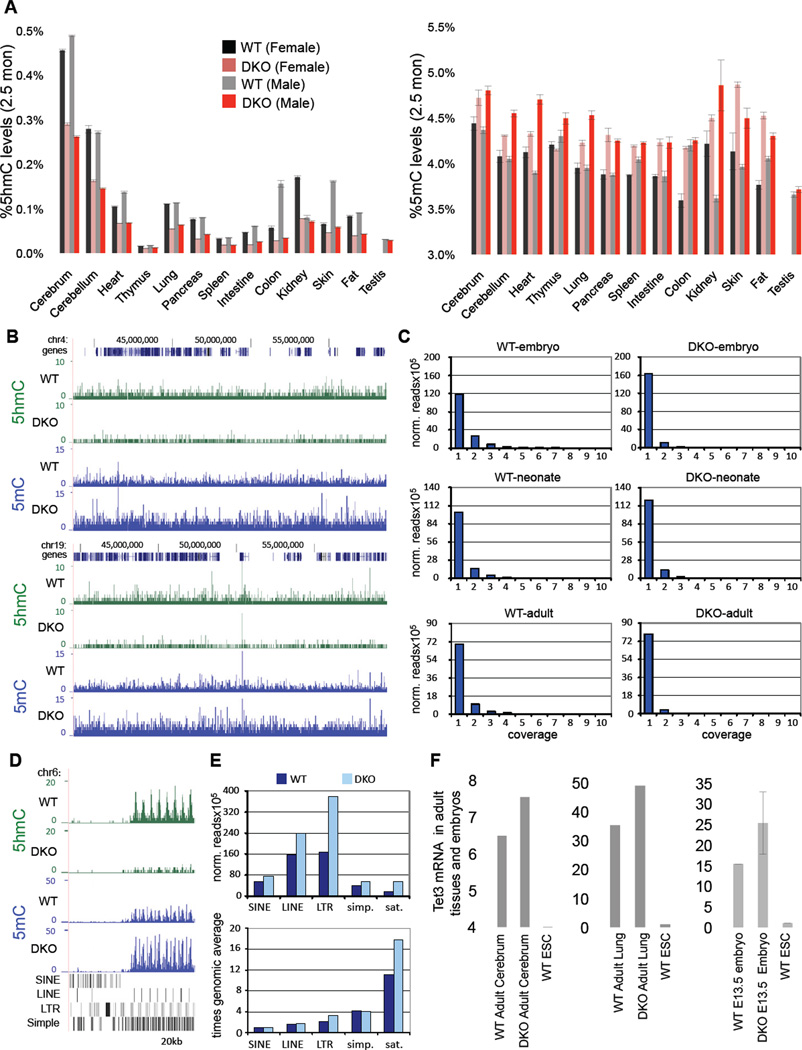
Figure 6. Hypermethylation and reduced 5hmC levels in Tet1/Tet2 deficient embryos and adult mice.
(A) Quantification of 5hmC and 5mC in various tissues of adult 2.5-month-old male and female mice by mass spectrometry. (B) hMeDIP-seq (green) and MeDIP-seq (blue) profiles of two 20 MB regions from mouse chromosome 4 (upper panel) and 19 (lower panel). MeDIP was performed on genomic DNA extracted from WT and DKO tails of neonates (pup#7 and #15, respectively). hMeDIP was performed on genomic DNA extracted from WT and DKO adult cerebrum. Enrichments are indicated as normalized read counts. UCSC transcription units are indicated on top in dark blue. Genomic features are viewed as custom tracks in the UCSC genome browser. (C) Quantitative analysis of MeDIP results. Normalized 5mC read counts for each sample were determined for all bases and then distributed into bins with increasing read counts (1–10). The resulting profiles from DKO samples show a consistent increase in the number of bases that are covered by a single read, representing low-level methylation. At the same time, the number of bases with higher coverage becomes decreased in DKO samples. Samples analysed were from WT and DKO neonates (MeDIP performed on DNA from tail/hind leg), embryos (MeDIP performed on DNA from total brain) and adults (MeDIP performed on DNA from cerebrum). (D) hMeDIP-seq and MeDIP-seq profiles (as in B) of the flanks of a CpG-rich repeat region on chromosome 6 (chr6:47,563,923-47,636,951). Genomic features are shown as custom tracks in the UCSC genome browser. (E) Quantitative MeDIP analysis of repetitive elements in WT (dark blue) and DKO (light blue) neonates. The upper panel shows normalized 5mC read counts for several classes of repetitive elements, as indicated. The lower panel shows the enrichment of repetitive element sequencing reads relative to the genome-wide average (indicated by the red line). Abbreviations indicate Long Interspersed Nuclear Elements (LINEs), Short Interspersed Nuclear Elements (SINEs), Long Terminal Repeats (LTRs), simple repeats (simp.) and satellite repeats (sat.). (F) Relative expression of Tet3 in various embryos and adult tissues. Data are normalized to Gapdh. For all panels error bars indicate s.d. See also Figure S3–S4.

