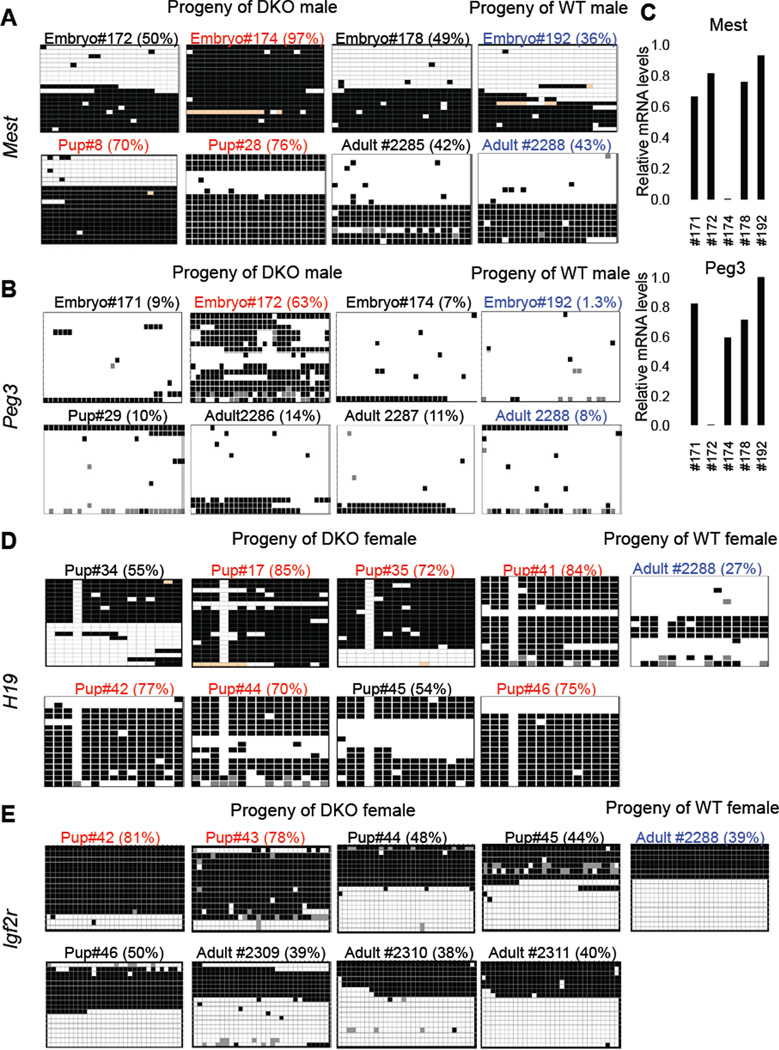
Figure 7. Tet1/Tet2 deficiency partially compromises imprinting.
(A, B, D, E) Heat map representation of bisulfite sequencing analysis of imprinted genes in selected samples corresponding to table S1. Within each heat map columns represent each CpG position in the sequenced ICR. Rows represent individual clones sequenced. Total of 16 to 20 clones were analyzed for each sample. Black box= methylated, white box=unmethylated and orange or grey box=undetermined due to poor sequence quality. Values on top of each map are % methylated CpG sites. Samples with aberrant (more than 65% methylation) are shown in red. Control samples are shown in blue. Detailed description of the entire analysis and all samples analyzed can be found in Table S1. (C) RTqPCR for Mest and Peg3 in selected E13.5 embryos confirming loss of expression of these genes in embryos with increased methylation shown in A and B. See also Table S1.

