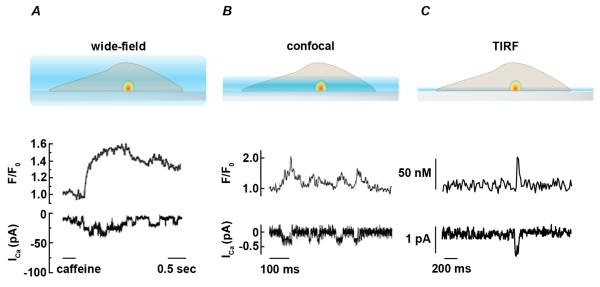
Figure 1. Relationship between excitation field and temporal resolution of fluorescent signals.
A. Schematic representation (top) showing excitation pattern (blue) for conventional wide-field fluorescent microscope. Fluorescent signal from cytosolic Ca2+ indicator is collected from within and outside of focal plane. Images reflect Ca2+ signals near point source (Ca2+-permeable channel) as well as Ca2+ accumulation in the cytosol. Therefore, rise and decay of the observed fluorescent signal is slower than corresponding single channel current measurements (bottom, redrawn from [16]). B. Cartoon representing excitation profile for confocal microscope with representative single channel current (ICa) and [Ca2+]i (F/FO) traces using line scan confocal microscopy (redrawn from [19]). Excitation field and Ca2+ influx is represented as in A. C. Representation of excitation profile for total internal reflection fluorescence (TIRF) microscope with representative single channel current (ICa) and [Ca2+]i (F/FO) traces (redrawn from [24]). Excitation field and Ca2+ influx is represented as in A.

