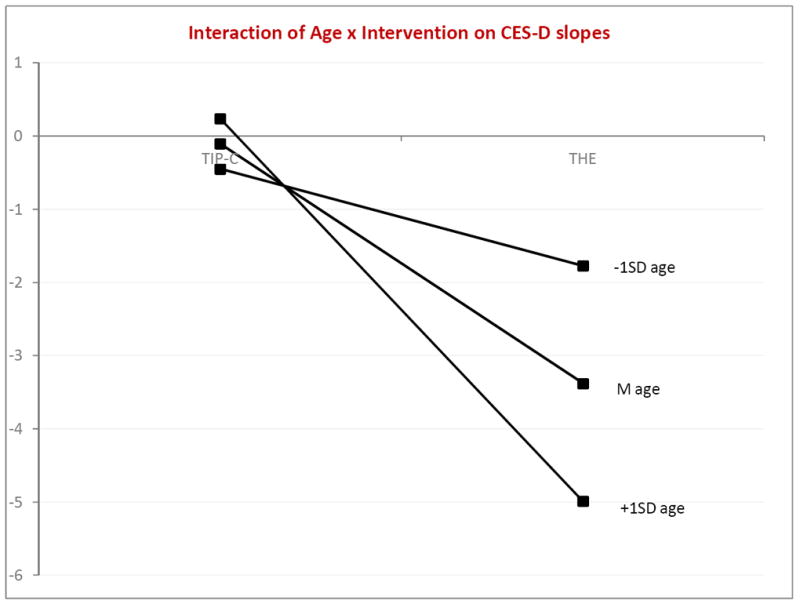
Figure 2. Illustration of Age × Intervention Condition Interaction on CES-D Slopes.

Note. Plotted values represent slopes. Therefore positive values indicate increases in depression over time and negative values indicate decreases in depression over time.
