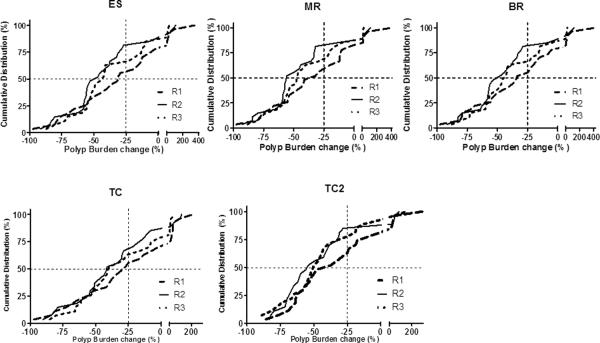
Figure 3.
Cumulative distribution of per cent changes in total polyp burden following 6 months of celecoxib treatment by reviewer and polyp burden measure. In the top 3 panels, total polyp burden was calculated as follows, where CS, CM, and CL were the counts of small (<2 mm), medium (2–4 mm), and large (>4 mm) polyps, respectively: equally spaced “ES”, polyp burden = (1×CS)+(2×CM)+(3×CL); mid-range “MR”, polyp burden = (1×CS)+(3×CM)+(5×CL); and bottom-range “BR”, polyp burden = (1×CS)+(2×CM)+(4×CL). TC “Total Count” indicates that total polyp burden was determined by summing the counts for polyps in all 3 size groups; TC2 “Count 2” indicates that total polyp burden was determined by summing the counts for medium (2–4 mm) and large (>4 mm) polyps only.

