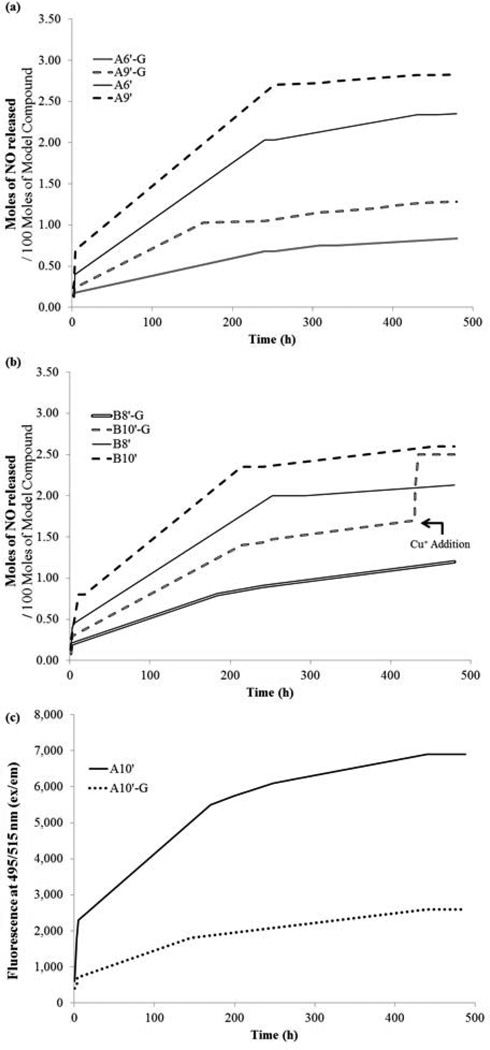
Figure 4.
The release profiles were determined in PBS solution at room temperature using Griess reagent to measure the nitrite concentration produced from the released NO in the presence and absence of GSH. Absorbance values at 550 nm were determined using a Molecular Devices Plate Reader. a) NO release profiles of A6’ and A9’ in the presence (A6’G, A9’G) and the absence of GSH (5 mM), determined by Griess reagent b) NO release profiles of B8’ and B10’ in the presence (B8’G, B10’G) and the absence of GSH (5 mM). Addition of catalytic amount of Cu+ to B10’G at t=430 h resulted in the release of NO from GSNO. A fluorescent probe DAF-FM was used as an alternate probe to detect NO and/or N2O3. Fluorescent signals were detected using the same micro-plate reader at 495/515 (ex/em) c) NO release profiles of A10’ in the presence (A10’G) and the absence of GSH (5 mM) determined using DAF-FM.

