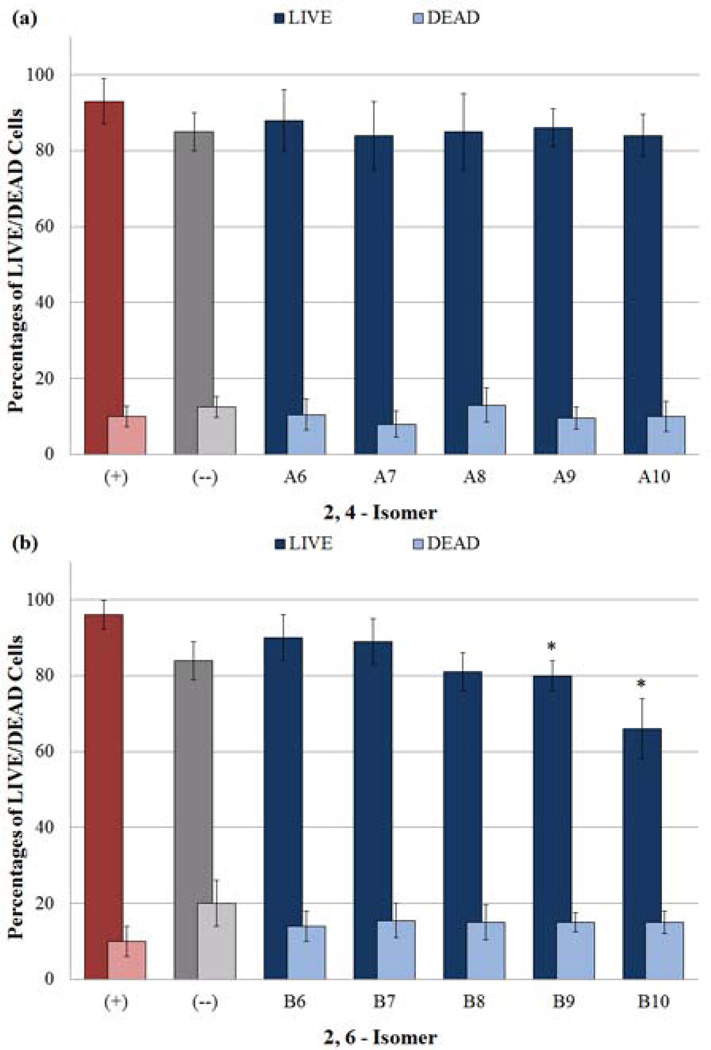
Figure 6.
Determination of cytotoxic effects by secondary amines on HASMC cultures using a LIVE/DEAD assay. Two distinct fluorescent measurements at em 495/ex 515 and em 495/ex 635 provided data points for calculating reported percentages of LIVE and DEAD cells respectively. (*) Indicates a statistically significant difference (p < 0.05) between the given compound/concentration combination and the vehicle alone. The concurrent decrease in LIVE cells and increase in DEAD cells exhibited by the negative control suggests 1% DMSO induces cell death. Therefore the use of DMSO as the vehicle accounts for the percentage of DEAD cells present in all tested samples. The graphical data represents the mean ± SE of triplicate determinations, and reveal the percentages of LIVE and DEAD cells resulting from exposure to a) A6–A10 and b) B6–B10.

