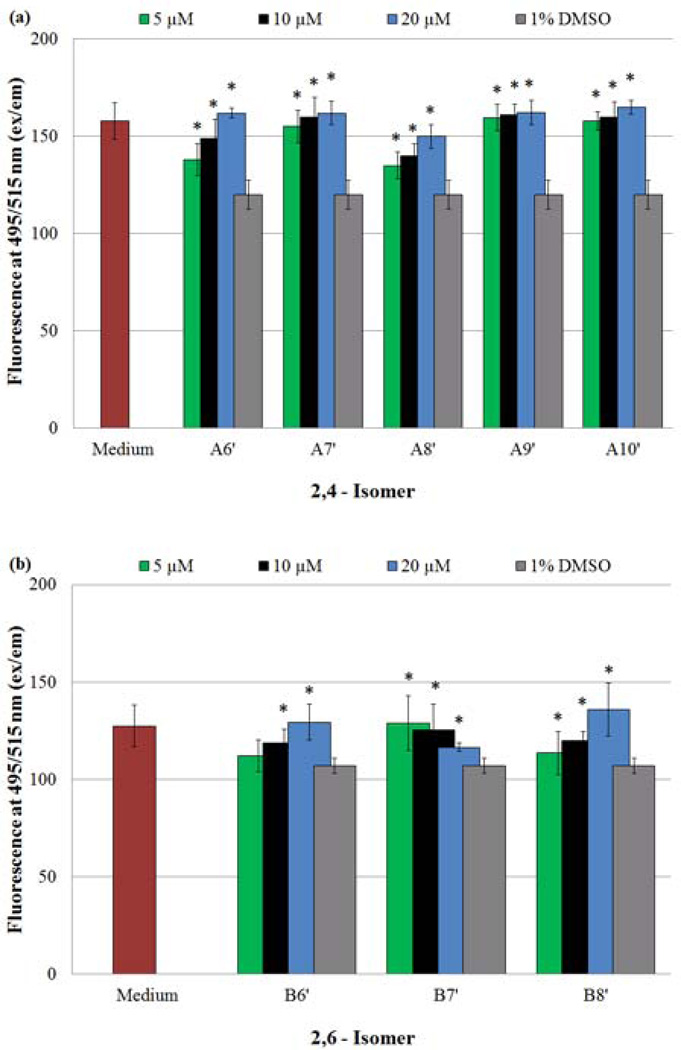
Figure 9.
Monitoring of intracellular NO and /or N2O3 concentrations of HASMCs exposed to NO-donors, using the membrane-permeable probe DAF-FM DA. Fluorescence measurements (ex 495/em 515) provided data points, which were reported using the given arbitrary units. (*) Indicates a statistically significant difference (p < 0.05) between the given compound/concentration combination and the vehicle alone. The graphical data represents the mean ± SE of triplicate determinations in the presence of a) A6’–A10’ and b) B6’–B10’.

