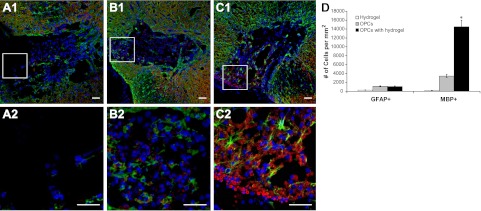
Figure 8.

Examination of transplanted OPCs in the lesion sites with 3 treatment groups. A1, A2) Optimized hydrogels only. B1, B2) OPCs only. C1, C2) OPCs with optimized hydrogels. Panels A2, B2, C2 show enlarged views of boxed areas in panels A2, B2, C2, respectively. D) Quantity analysis of transplanted OPCs. Green, GFAP staining for astrocytes; red, MBP staining for myelin; blue, DAPI staining for cell nuclei. Scale bars = 100 μm. *P < 0.05.
