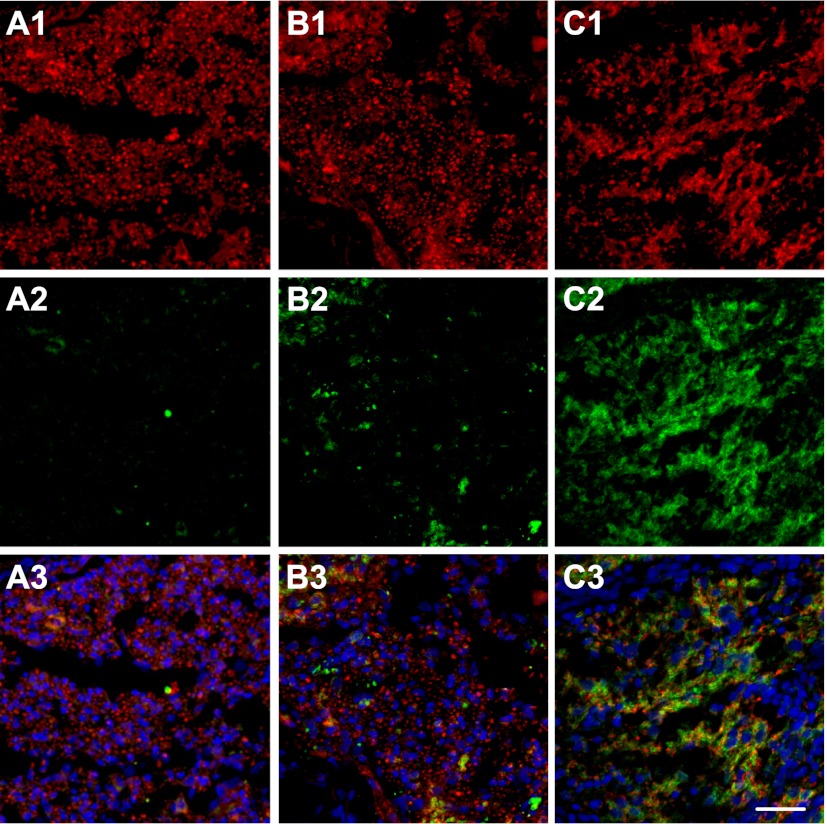
Figure 9.
Examination of remyelination in the lesion sites with 3 treatment groups. A1–A3) Optimized hydrogels only. B1–B3) OPCs only. C1–C3) OPCs with optimized hydrogels. Red. β III tubulin staining for axons (A1–C1); green, MBP staining for myelin (A2–C2); blue, DAPI staining for cell nuclei (A3–C3). Scale bar = 200 μm.

