
Figure 3.
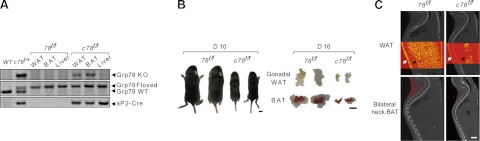
Adipose deletion of Grp78 leads to lipoatrophy. A) Representative PCR genotyping results from WAT (gonadal) and BAT and liver isolated from the 78f/f and c78f/f mice, using the tail DNA from the indicated genotypes as controls. B) Representative images of 78f/f and c78f/f mice at postnatal d 10 (left panel) and gonadal WAT and BAT from the 78f/f and c78f/f mice at postnatal d 16 (right panel). C) Micro-CT scout views comparing the adiposity of 78f/f and c78f/f mice at postnatal d 23. WAT was visualized as yellow dots (top panels) and BAT as red dots (bottom panels). White arrows indicate the locations of subcutaneous WAT and black arrows locations of abdominal WAT. Scale bars = 5 mm (B); 3 mm (C).