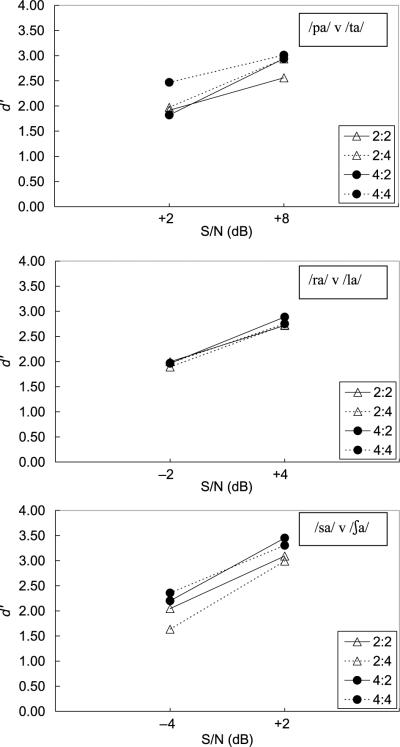
Figure 1.
Mean d′ performance across signal-to-noise ratio (S/N). The top panel displays mean performance for the stop-consonant contrast, /pa/ versus /ta/ (n = 10), the middle panel displays that for the liquid contrast, /ra/ versus /la/ (n = 10), and the bottom panel displays mean performance for the fricative contrast, /sa/ versus /ʃa/ (n = 10). Triangles and circles indicate a standard number of 2 and 4 repetitions, respectively. Solid and dotted lines indicate a comparison number of 2 and 4 repetitions, respectively.

