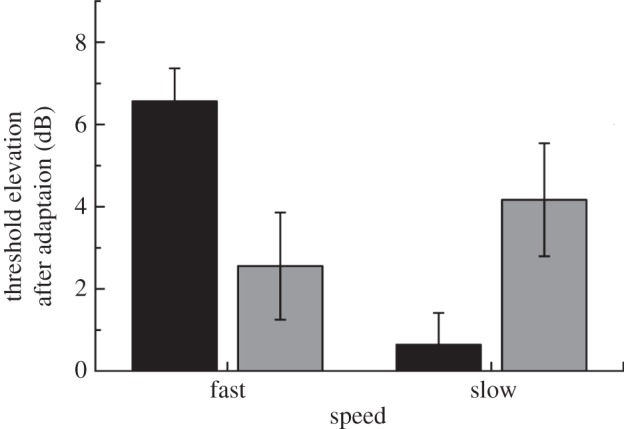
Figure 3.

Mean results from the psychophysical adaptation experiment for eight participants. Error bars denote ±1 s.e.m. There was a significant interaction between orientation and speed, F1,7 = 39.29, p < 0.001; see §§3 and 4 for details. Black bars, parallel; grey bars, orthogonal.
