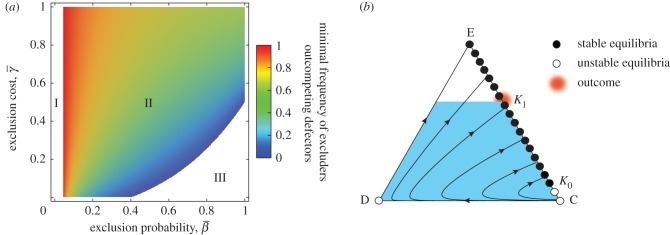
Figure 2.

Effects of excluding freeriders. (a) Between the excluders and freeriders. I: If  is smaller than a threshold value
  , the defectors dominate. II: If
  is greater than
  , exclusion leads to bistable competition between the two strategies. With increasing
  or decreasing
  the minimal frequency of the excluders outcompeting the defectors decreases. III: If
  and
and  are sufficiently high and low, the excluders dominate. The parameters are as in figure 1a. (b) In the presence of second-order freeriders. The triangle is as in figure 1b, except that z denotes the excluder frequency and the vertex E corresponds to its homogeneous state. Similarly, the edge EC consists of a continuum of equilibria. Here, we specifically assume
  and
and  . EC is separated into stable and unstable segments. The coloured area in the interior of triangle is the region in which
  holds. In fact, given the occasional mutation to a defector, the population's state must converge to the vicinity of the point K1, because the advantage of the excluders over the cooperators becomes broken when the population's state goes up beyond K1.
