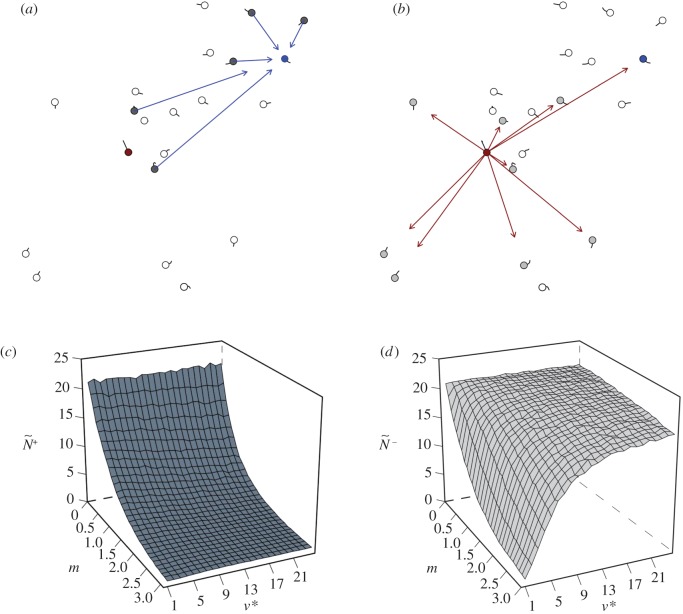
Figure 1.
Snap shots of the initial communication networks that emerge when a single member, acting as a transmitter, ignores its neighbours and departs with motion cue v*. Average attention level,  , reflects the median number of neighbours that influenced a receiver (ex. a, receiver in blue). Average transmitter influence,
  , reflects the median number of neighbours that were influenced by its movement behaviour (ex. b, transmitter in red). The resulting attention/influence communication networks are defined by
  (c) and
  (d), respectively. The decay in attention level with m reflects the physical nature of dispersed neighbours, whose motion cues decay exponentially with distance (c;
  ; see the electronic supplementary material, appendix S.1). There are 1000 replicates per parameter combination, η = 0.1 and
  . Results are for motion-guided attention only (see the electronic supplementary material, appendix S.3 for corresponding figures related to communications under numerically limited attention).

