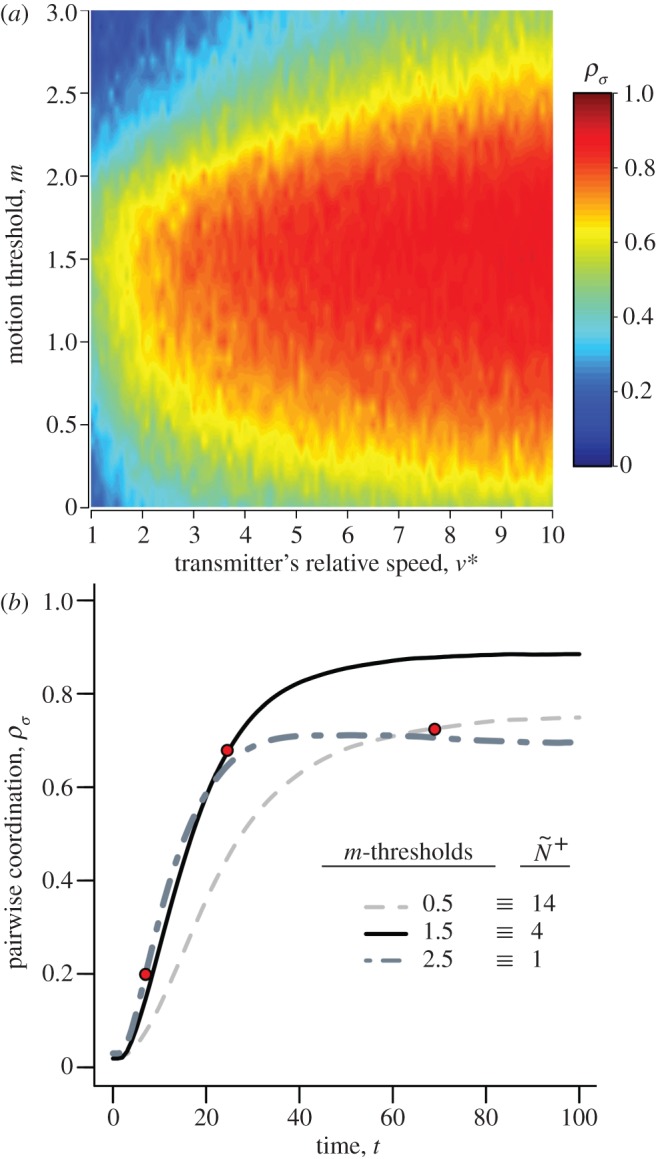
Figure 2.

(a) Coordination accuracy between transmitter–receiver pairs (T–R, t = 100) as a function of the transmitter's motion cue, v*, and the receiver's motion threshold, m. (b) Time series of the average trends in T–R coordination during a social disturbance (v* = 10) for three attention levels. Red dots indicate the median time that receivers tracked their transmitter's motion through the crowd (i.e.  ; equation (2.3)). v* is limited to
  to reflect the saturation point seen in (a) and corresponds to the relative speeds displayed by startled fish [34]. Trend lines in (b) reflect median values that are all smoothed by the same exponential moving average. Parameter values and conditions match those in figure 1.
