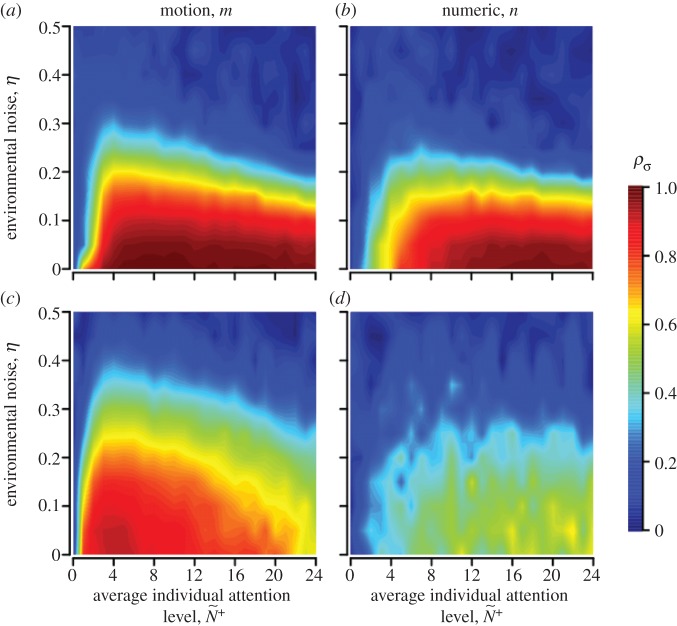
Figure 3.
Coordination accuracy between T–R pairs as a function of ecological context, environmental noise (η) and attention. Individuals adopt either a motion threshold (a,c) or a numerical threshold (b,d). Under normal patch departures all individuals interact socially and move at similar speeds (a,b). During disturbed departures a startled transmitter ignores its neighbours and departs with a motion cue of v* = 10 (c,d). Coordination is shown as a function of individual attention level to facilitate comparison between the attention mechanisms (see the electronic supplementary material, appendix S.4 and movies S1–S3 for example). Simulations lasted 1000 and 100 time steps for normal and disturbed scenarios, respectively; 500 replicates per parameter combination; initial dispersion level is  (see electronic supplementary material, table A1 and appendix S.2 for parameter values and rationale).

