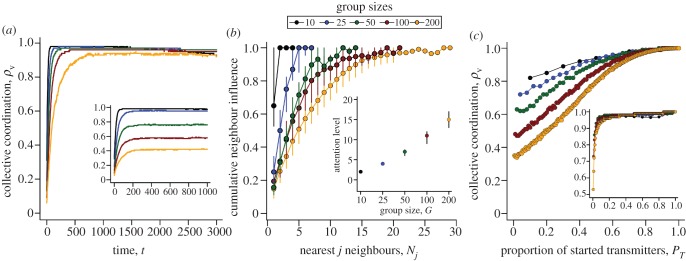
Figure 5.

The effects of group size, movement behaviour and attention mechanisms on collective coordination. Average trends in collective coordination in groups of 10–200 individuals over time when members adopt either motion (a; main) or numerical (a; inset) thresholds. (b) The cumulative influence of G and the Nj nearest influential neighbours on the magnitude of the typical receiver's response. Each successive influential neighbour provides additional movement information whose proportional contribution is given by  . The sum of all influential motion weights is then averaged to scale the receiver's response to its social stimuli (equations (2.2) and (2.5)). Inset (b) shows the median receiver attention levels as a function of group size under a fixed motion threshold. Points and error bars represent 25, 50 and 75% quantiles. (c) Collective coordination across groups of varying size as a function of the number of transmitters and their motion cue, where v* = 1 (main) and 10 (inset). Starting values of ρv equate to those at t = 100 in (a) for each group size. When v* = 1 transmitters have limited social influence, but their directional influence increases dramatically when v* = 10 (Note the lower limits in the y-axis.). Parameter values for all simulations: m = 1.5, n = 7 (a; inset only),
  at t = 0, η = 0.1.
