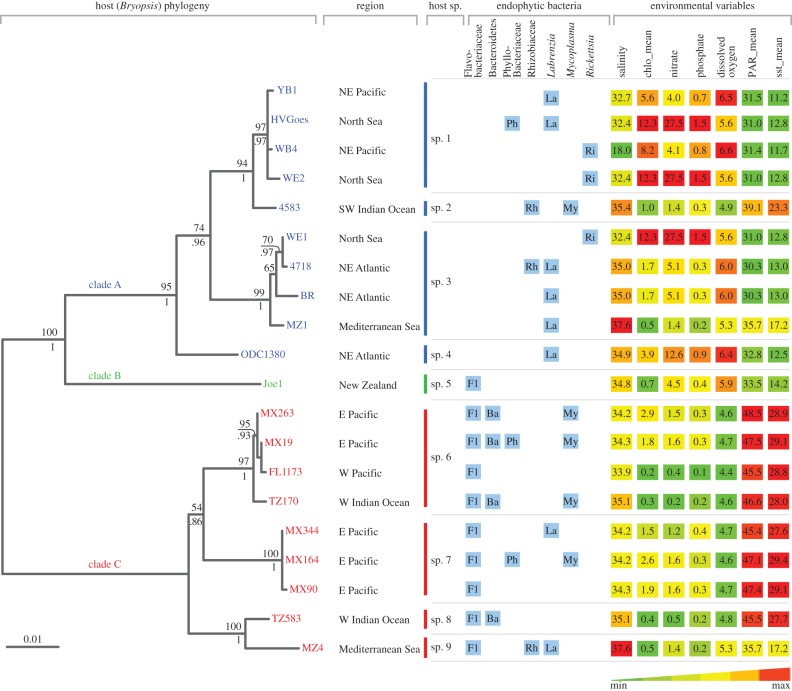
Figure 2.
Endophytic diversity results, geographical data and environmental variables plotted against the Bryopsis host phylogram. The endophytic bacterial diversity, displayed by blue boxes, summarizes the diversity results from the 16S rRNA gene clone libraries and DGGE analyses. Environmental variables were extracted from the host sampling sites using Bio-ORACLE, salinity (PSS); chlo_mean, annual mean chlorophyll (mg m−3), nitrate (μmol l−1), phosphate (μmol l−1), dissolved oxygen (ml l−1); PAR_mean, annual mean photosynthetically available radiation (µmol m−2 s−1); sst_mean, annual mean sea surface temperature (°C). The phylogram on the left classifies the 20 algal samples for which endophytic bacterial data are available in nine different Bryopsis species and three distinct clades (i.e. A, B and C). These clades seem more consistent with the ecology of the host samples (environmental variables depicted on the right) than with their geographical origin (sample region). Maximum-likelihood bootstrap values and Bayesian inference posterior probabilities, respectively, are indicated above and below the branch nodes. The scale bar indicates 0.01 nucleotide changes per nucleotide position. NE, northeast; SW, southwest; E, east; W, west.

