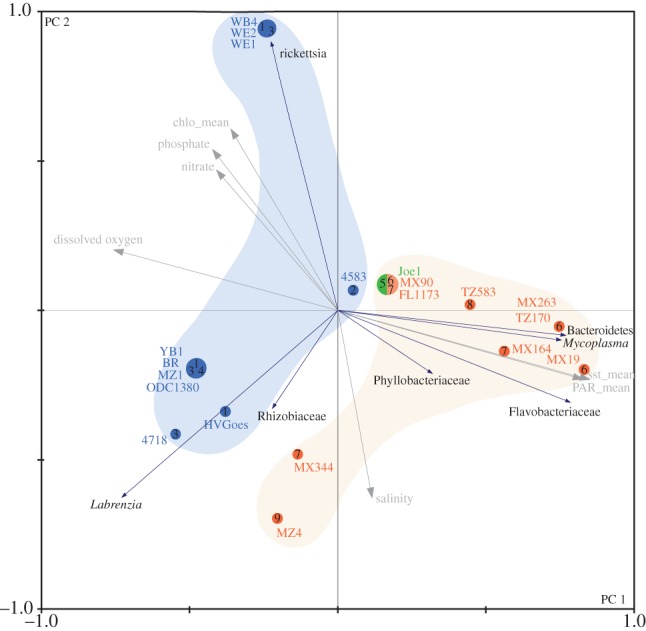
Figure 3.

PCA of the 20 Bryopsis samples for which endophytic bacterial information is available. The PCA plot spreads the host samples in direction of maximum variance in endophytic bacterial community composition with principal component 1 explaining 41.7% and principal component 2 explaining 19.9% of the variance. Bryopsis species are indicated as numbers 1–9 and phylogenetic clades A, B and C are shown in blue, green and red, respectively. Environmental variables (in grey) were plotted on the PCA graph in the electronic supplementary material.
