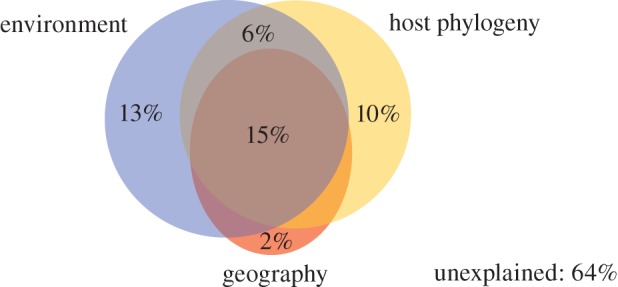
Figure 4.

Partitioning the variation in total bacterial species composition explained by phylogenetic, environmental and geographical variables. Adjusted R2 values are given. A detailed overview of the variation partitioning results is provided in the electronic supplementary material, table S4.
