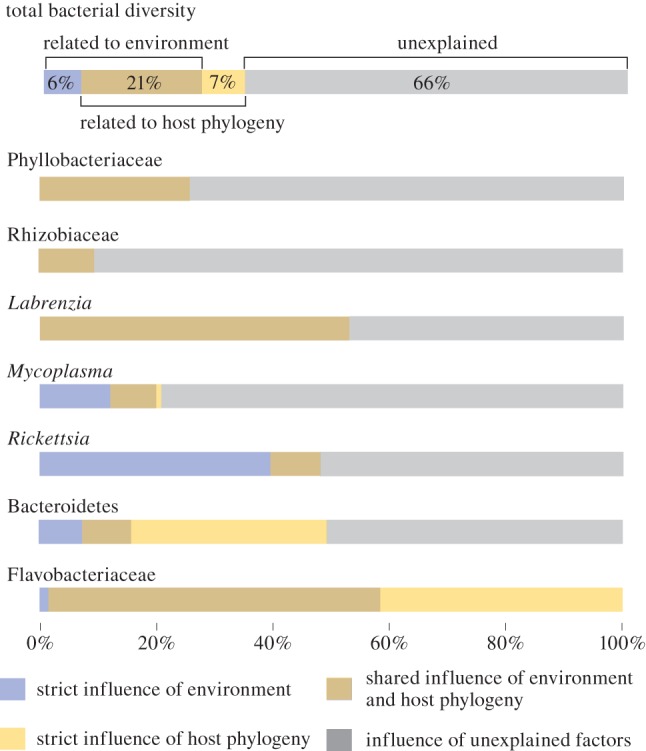
Figure 5.

Partitioning the variation in bacterial species composition explained by phylogenetic and environmental variables. Diagrams show the unique and shared influences of both factors on the variation in total endophytic bacterial diversity and the individual endophytic phylotypes. Adjusted R2 values are given or illustrated. Negative fractions (which indicate that two explanatory variables have strong and opposite effects on the dependant variable) are treated as zeros in the graphs. A detailed overview of the variation partitioning results is given in the electronic supplementary material, table S4.
