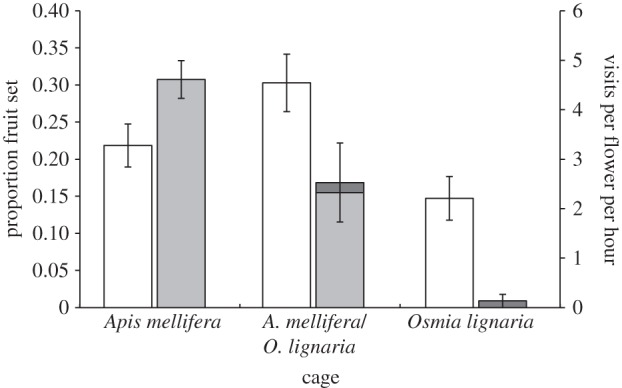
Figure 3.

The average proportion fruit set per tree in three cages containing eight almond trees each. One cage contained only Apis mellifera, one contained only Osmia lignaria and one contained a mix of both (white bars represent fruit set and grey bars represent visitation). Owing to the different numbers of bees in the cages, the average flower visitation rates are also shown (A. mellifera in lighter grey, O. lignaria in darker grey). The error bars are the s.e. of the mean per tree.
