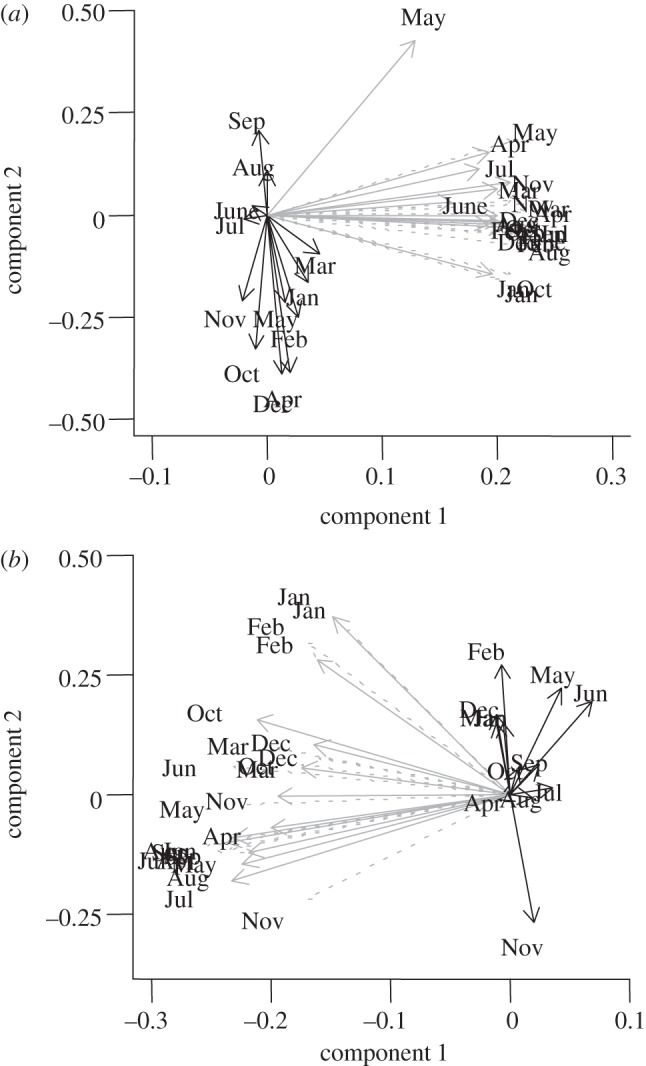
Figure 2.

Ordination plot generated from principal component analysis of precipitation and mean maximum and minimum temperature in each month among the locations of the (a) defoliation and (b) acorn datasets. Precipitation variables are displayed with solid black lines, mean maximum temperatures with solid grey lines and mean minimum temperatures with dotted grey lines.
