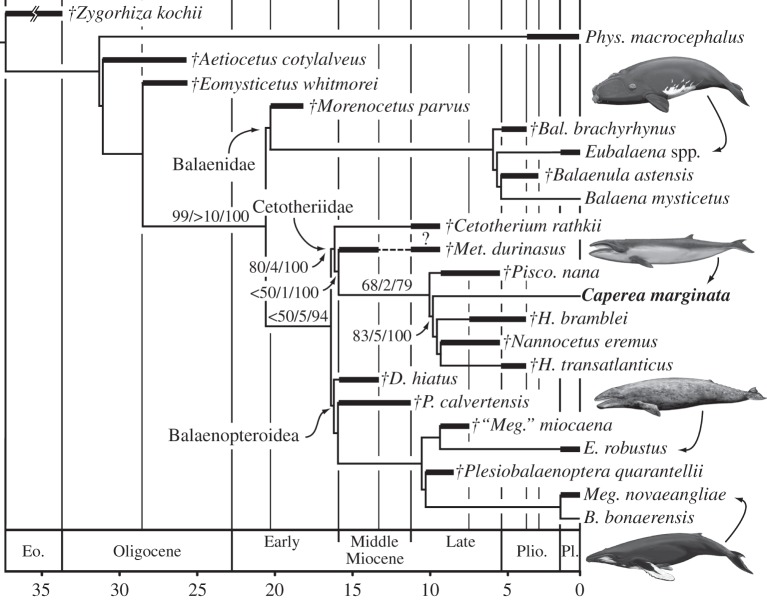
Figure 3.
The evolutionary relationships of C. marginata based on the results of the parsimony-based morphological and Bayesian total evidence analyses. The tree shown represents the single tree recovered by the parsimony-based analysis of the morphological data only (426 steps, CI = 0.509, RI = 0.655). The tree recovered by the Bayesian analysis was very similar to the one shown here, and differed only in the detailed intra-relationships of the balaenids and balaenopterids, as well as a slightly lower degree of resolution (see the electronic supplementary material). Branch support represents GC values arising from symmetric resampling [24] and Bremer support values [23], as well as posterior probabilities arising from the Bayesian analysis (see the electronic supplementary material for full details). Stratigraphic ranges are based on Uhen [18] and additional information provided in the electronic supplementary material, and should be interpreted as conservative range estimates, rather than actually demonstrated ranges. B., Balaenoptera; Bal., Balaenella; D., Diorocetus; E., Eschrichtius; H., Herpetocetus; Meg., Megaptera; Met., Metopocetus; P., Pelocetus; Pisco., Piscobalaena; Phys., Physeter. Drawings of living mysticetes by Carl Buell. Daggers indicate extinct species.

