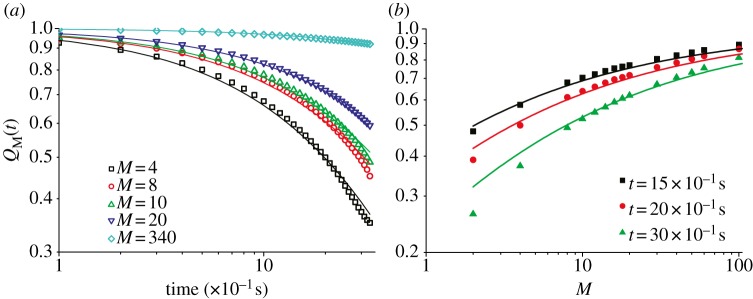
Figure 3.

(a) Neighbour overlap QM(t) versus t. (b) QM(t) versus M. Full lines represent equation (2.9) with c = 0.048 (fitted value), whereas  and α = 1.72 have the values predicted by the geometrical argument described in the electronic supplementary material. Data are for flock 69-10.
