
Figure 3.
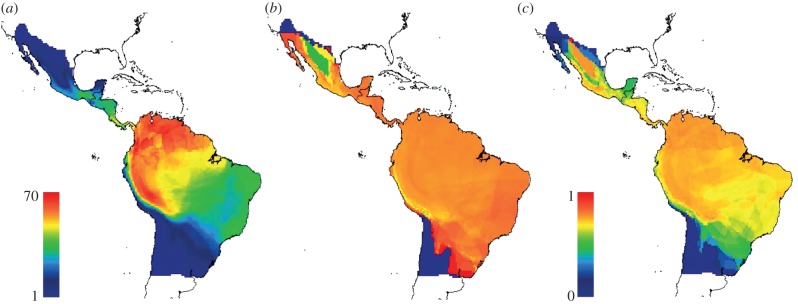
Geographic variation of (a) species richness, (b) PSV and (c) PSC for phyllostomid assemblages' present at each cell of the gridded domain. Scaled colour ramp for (b) and (c) is the same (0,1). (Online version in colour.)
Official websites use .gov
A
.gov website belongs to an official
government organization in the United States.
Secure .gov websites use HTTPS
A lock (
) or https:// means you've safely
connected to the .gov website. Share sensitive
information only on official, secure websites.
Geographic variation of (a) species richness, (b) PSV and (c) PSC for phyllostomid assemblages' present at each cell of the gridded domain. Scaled colour ramp for (b) and (c) is the same (0,1). (Online version in colour.)