Figure 1.
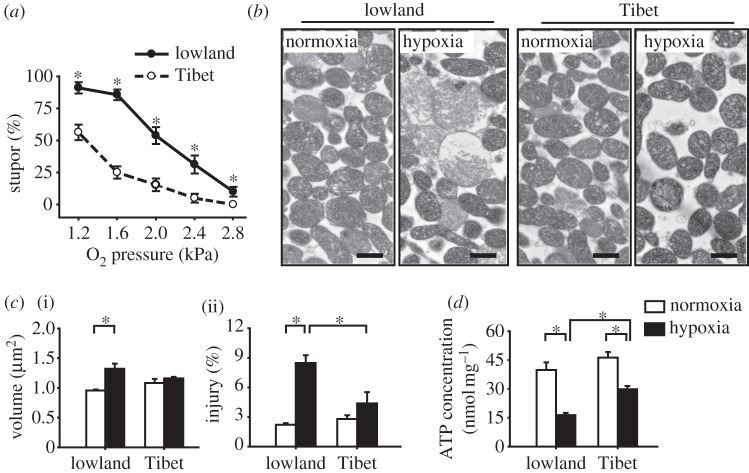
Differences between the hypoxia responses of Tibetan and lowland migratory locust populations in terms of stupor percentage, mitochondrial morphology, and ATP concentration. (a) Percentages of locusts in stupor in the two locust populations after various oxygen partial pressure (PO2) treatments for 6 h. The most significant difference was detected under 1.6 kPa PO2; thus, this hypoxic treatment was used in all subsequent assays. All samples have six replicates (n = 6), except n = 21 for treatment under 1.6 kPa PO2. (b,c) Mitochondrial morphology in the ultrathin section of the isolated mitochondrial pellet in the two locust populations under normoxic and hypoxic treatments. Representative micrographs of the mitochondria are shown in (b), as well as the volume of individual mitochondrion in (c, (i) n = 7) and the percentages of injured mitochondria in (c, (ii) n = 7). The black bars represent 1 μm. (d) ATP concentrations in the flight muscle mitochondria after normoxic and hypoxic treatments. Normoxia: 21 kPa PO2. Hypoxia: 1.6 kPa PO2. *p < 0.05 (t-test) for comparisons between the Tibetan and lowland locusts under the same PO2 treatment in (a), as well as for the represented comparisons in (c) and (d).

