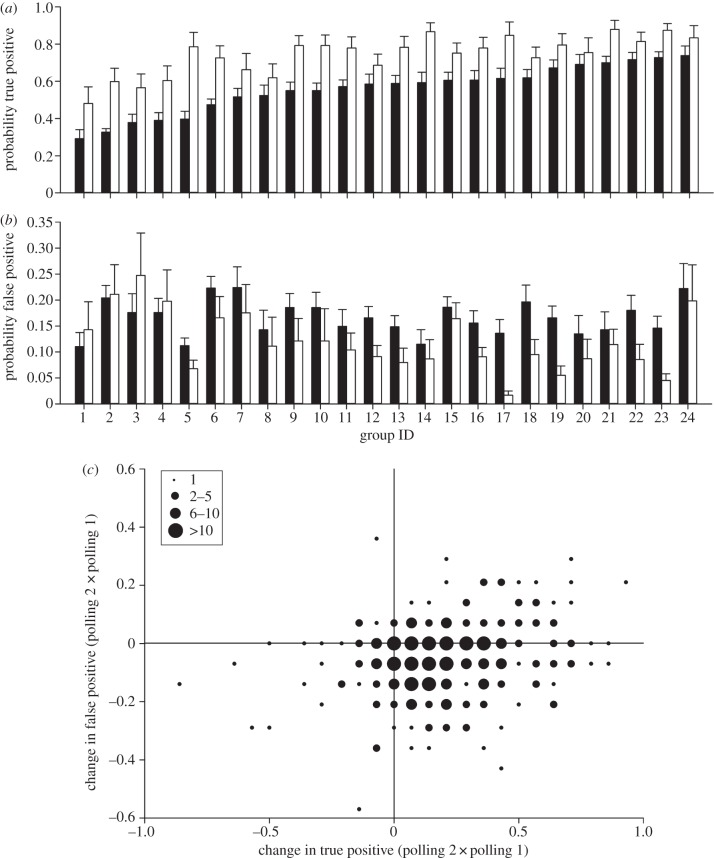
Figure 3.
After taking the decision of other group members into account (polling 2), individuals both increase their true positives and decrease their false positives. (a,b) When comparing polling 2 (white bars) with polling 1 (black bars), (a) the average true positive of individuals increased in all 24 groups, (b) the average false positive of individuals decreased in 20 out of 24 groups. Shown are mean±s.e.; for clarity, the groups in (a) and (b) are ranked according to their true-positive score of polling 1. (c) This pattern was also true on the individual level: After taking the decision of other group members into account (polling 2), a large proportion (40.2%) of the participants (N = 436) both increase true positives and decrease false positives, a substantial proportion (28.5%) either increase true positives with no change in false positives or decrease false positives with no change in true positives. The size of the circles indicates the number of individuals with identical changes in true and false positives.

