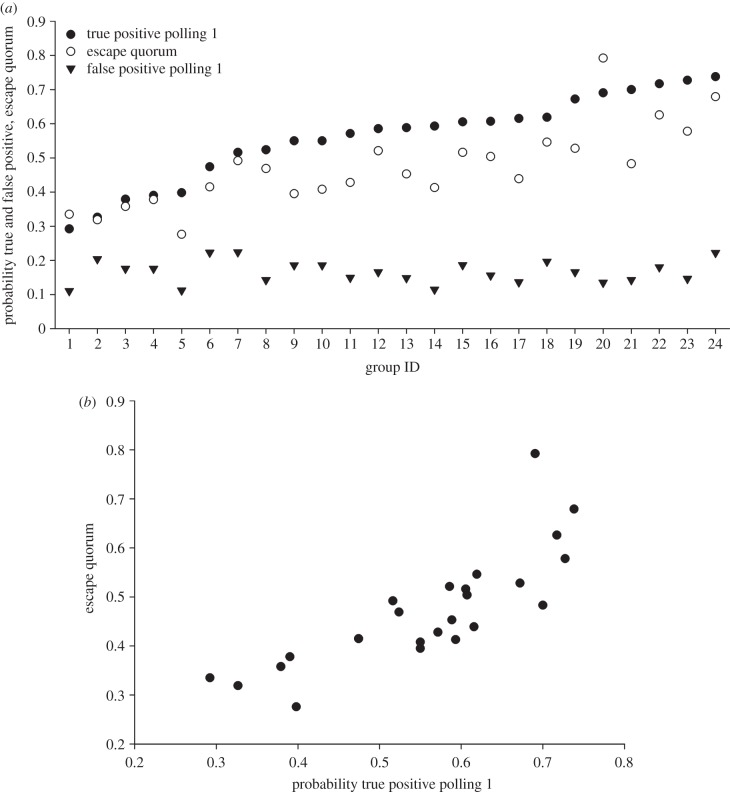
Figure 4.
When taking the decisions of the other group members into account, individuals use a quorum threshold set between the average true- and false-positive rates of the other group members. (a) For each group, average true- (filled circle) and false- (filled triangle) positive scores during polling 1 and the estimated escape quorum T (open circle) are shown. The escape quorum corresponds to the quorum threshold at which half of the individuals that decided to stay during polling 1 decided to escape during polling 2 (see the electronic supplementary material). As predicted, for 22 out of 24 of the groups, the escape quorum T lies below the average true-positive score and above the average false-positive score of individuals within that group. (b) There was a strong positive correlation between escape quorum and the average true-positive score during polling 1 (Spearman's rho = 0.858, p < 0.001, n = 24) suggesting that individuals adaptively adjust their escape quorum in accordance to the performance of the group. For clarity, the groups in (a) are ranked according to the true-positive score of polling 1.

