
Figure 2.
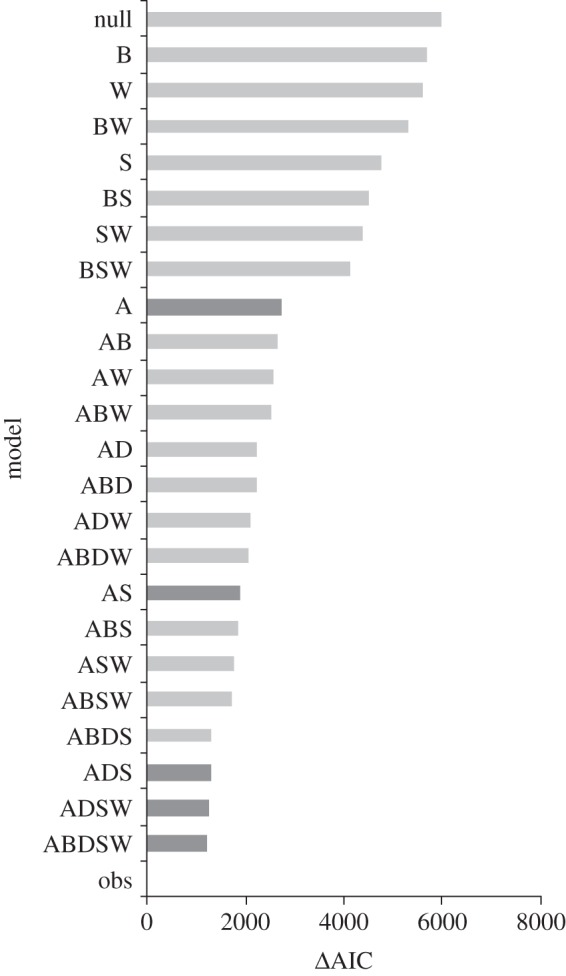
ΔAIC values for models of determinants of network structure that incorporate data on: A, species abundance; B, bark texture of woody species; D, plant size (DBH); S, spatial overlap; W, wood density and their combinations. obs, observed data; null, null model. The dark grey bars indicate the best performing models of one, two, three, four and five factors.