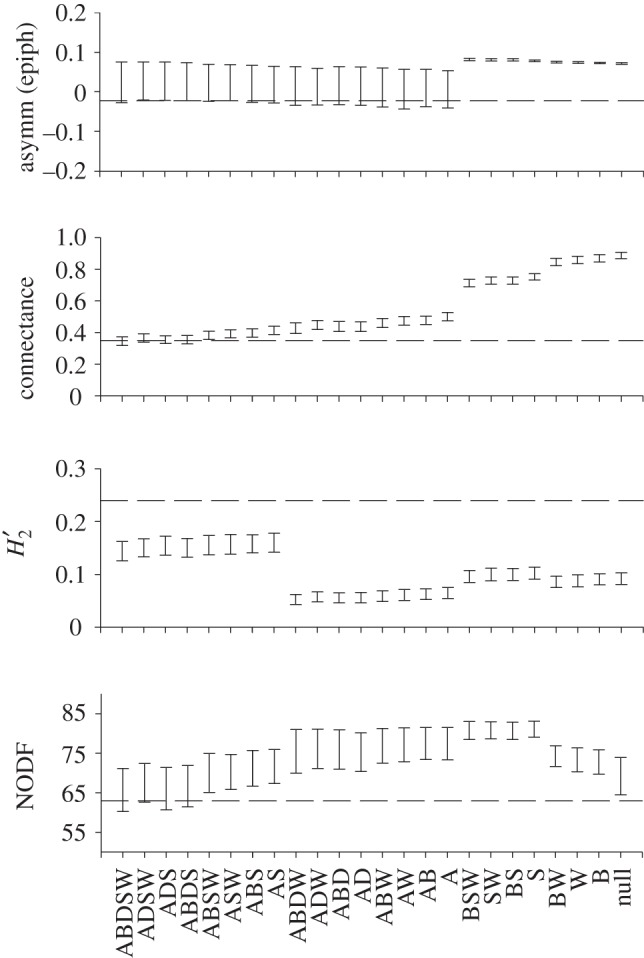
Figure 3.

Network statistics for the observed epiphyte–phorophyte network and for networks yielded by models of determinants of network structure. Model names as in figure 2. The dashed line indicates the observed value. Interaction strength asymmetry of epiphytes, connectance,  specialization and nestedness (NODF) are shown. Other statistics are reported in the electronic supplementary material, figure S1.
