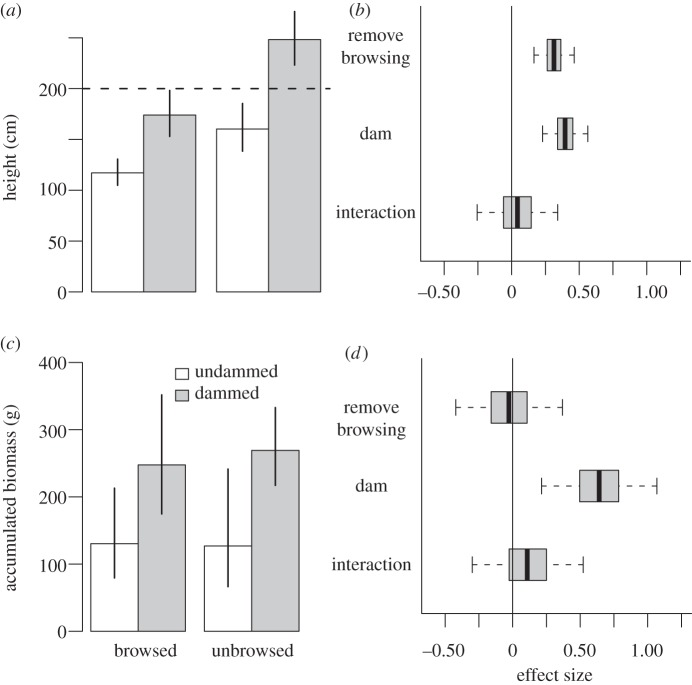
Figure 2.
Willow responses after 10 years. (a) Unbrowsed willows grew taller than browsed willows, and dammed willows grew taller than undammed plants (bars = mean heights from the fit model). Unbrowsed, dammed willows exceeded the 2 m height threshold (dashed line). (b) Dams and browsing removal had similar effects on height after 10 years, but prediction intervals on the interaction between the two treatments overlapped zero. (c) Biomass accumulated at similar rates whether or not willows were browsed, but damming plots increased biomass accumulation through time. (d) Dams had a large positive effect on biomass, whereas removing browsing had no effect. (a,c) White bars, undammed; grey bars, dammed. Error bars indicate 95% prediction intervals. (b,d) Heavy line, mean; horizontal bars, 50% prediction intervals; whiskers, 95% prediction intervals.

