
Figure 1.
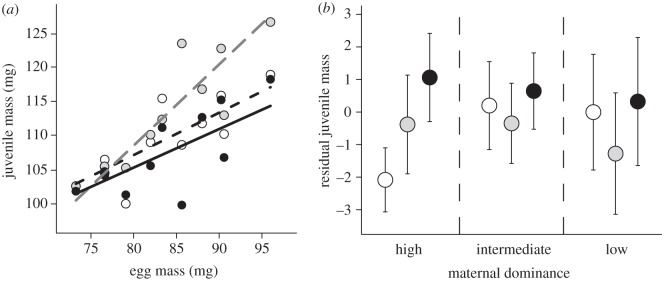
Juvenile body mass at the first feeding stage of development in relation to (a) egg mass (mean value per family) and (b) maternal dominance. In both cases, juvenile mass depends on the position within the egg mass (front, middle or rear) from which the juveniles originated. In (a), lines are the predicted values for each egg mass position from the final LME model (see electronic supplementary material, table S3 for statistical analysis). White circles/dashed black line, front of egg mass; grey circles/dashed grey line, middle of egg mass; black circles/solid black line, rear of egg mass. The predicted values are based on a female of average dominance (2.95). Juvenile mass data are mean family values (n = 10 per egg mass position). In (b), points are mean residual values (± s.e.) averaged by egg mass position across females of different dominance status: white circles, front of egg mass; grey circles, middle of egg mass; black circles, rear of egg mass. High dominance, mothers ranked between 1.0 and 2.0 (n = 4); intermediate dominance, mothers ranked between 2.5 and 3.0 (n = 4); low dominance, mothers ranked between 4.0 and 5.5 (n = 3). Residual juvenile mass values were derived from an LME model with family as a random factor and mean family egg mass × egg mass position interaction as explanatory variables, because the relationship between juvenile mass and egg mass differed among sections of the egg mass (see electronic supplementary material, table S3). Maternal dominance effects have been plotted categorically to aid visual interpretation.