
Figure 2.
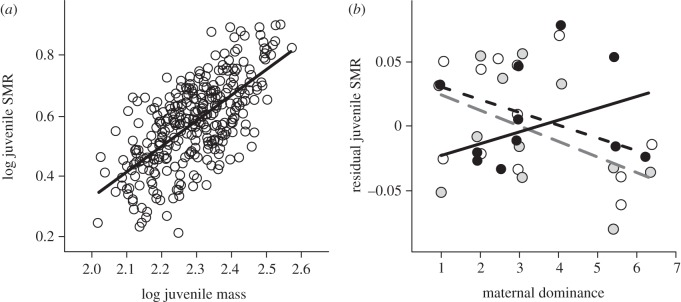
Standard metabolic rate (SMR) in relation to (a) body mass of juvenile trout (log values shown for both variables), and (b) maternal dominance and the position within the egg mass from which the juveniles originated. In (a), line represents the predicted values from the LME model describing the relationship between SMR and body mass. In (b) values are residuals from the regression shown in (a) and lines are the predicted values for each egg mass position from the final LME model (see electronic supplementary material, table S4 for statistical analysis). White circles/dashed black line, front of egg mass; grey circles/dashed grey line, middle of egg mass; black circles/solid black line, rear of egg mass.