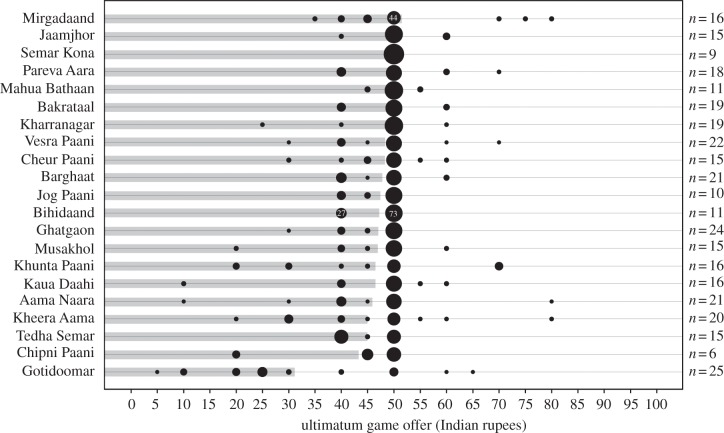
Figure 1.
Distributions of UG proposer offers across 21 villages. For each village on the y-axis, the areas of the black bubbles represent the proportion of individuals from the village who made an offer of the value on the x-axis. To indicate scale, the numbers in some bubbles are the percentage proportions represented by those bubbles. Grey horizontal bars indicate the mean offers for villages. Villages are ordered by their mean offers; the bottom village (Gotidoomar) has the lowest mean. Counts on the right (n) represent the number of proposers from each village (total n = 344). The overall mode across villages is 50 rupees (mean±s.d. = 46.61±10.40).

