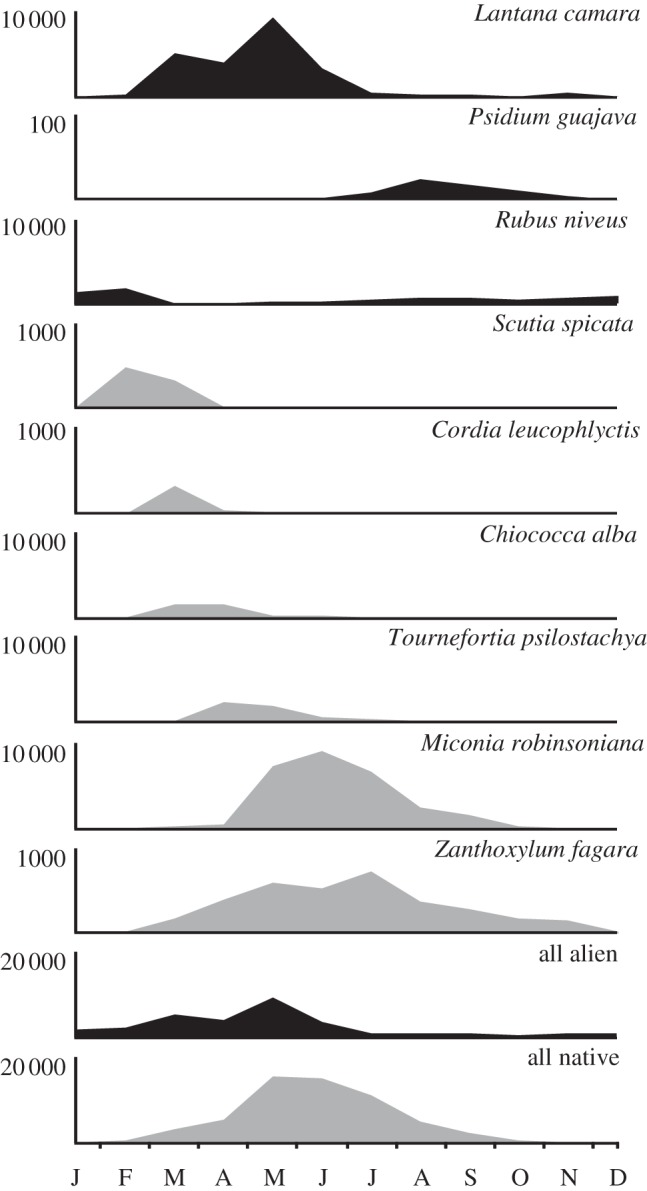
Figure 2.

Number of ripe fleshy fruits of the most abundant species counted along monthly linear transects in the eight study sites between March 2010 and February 2011. Alien species are represented in grey and native species in black. Note the different scales on the y-axis (values indicate the scale maximum).
